

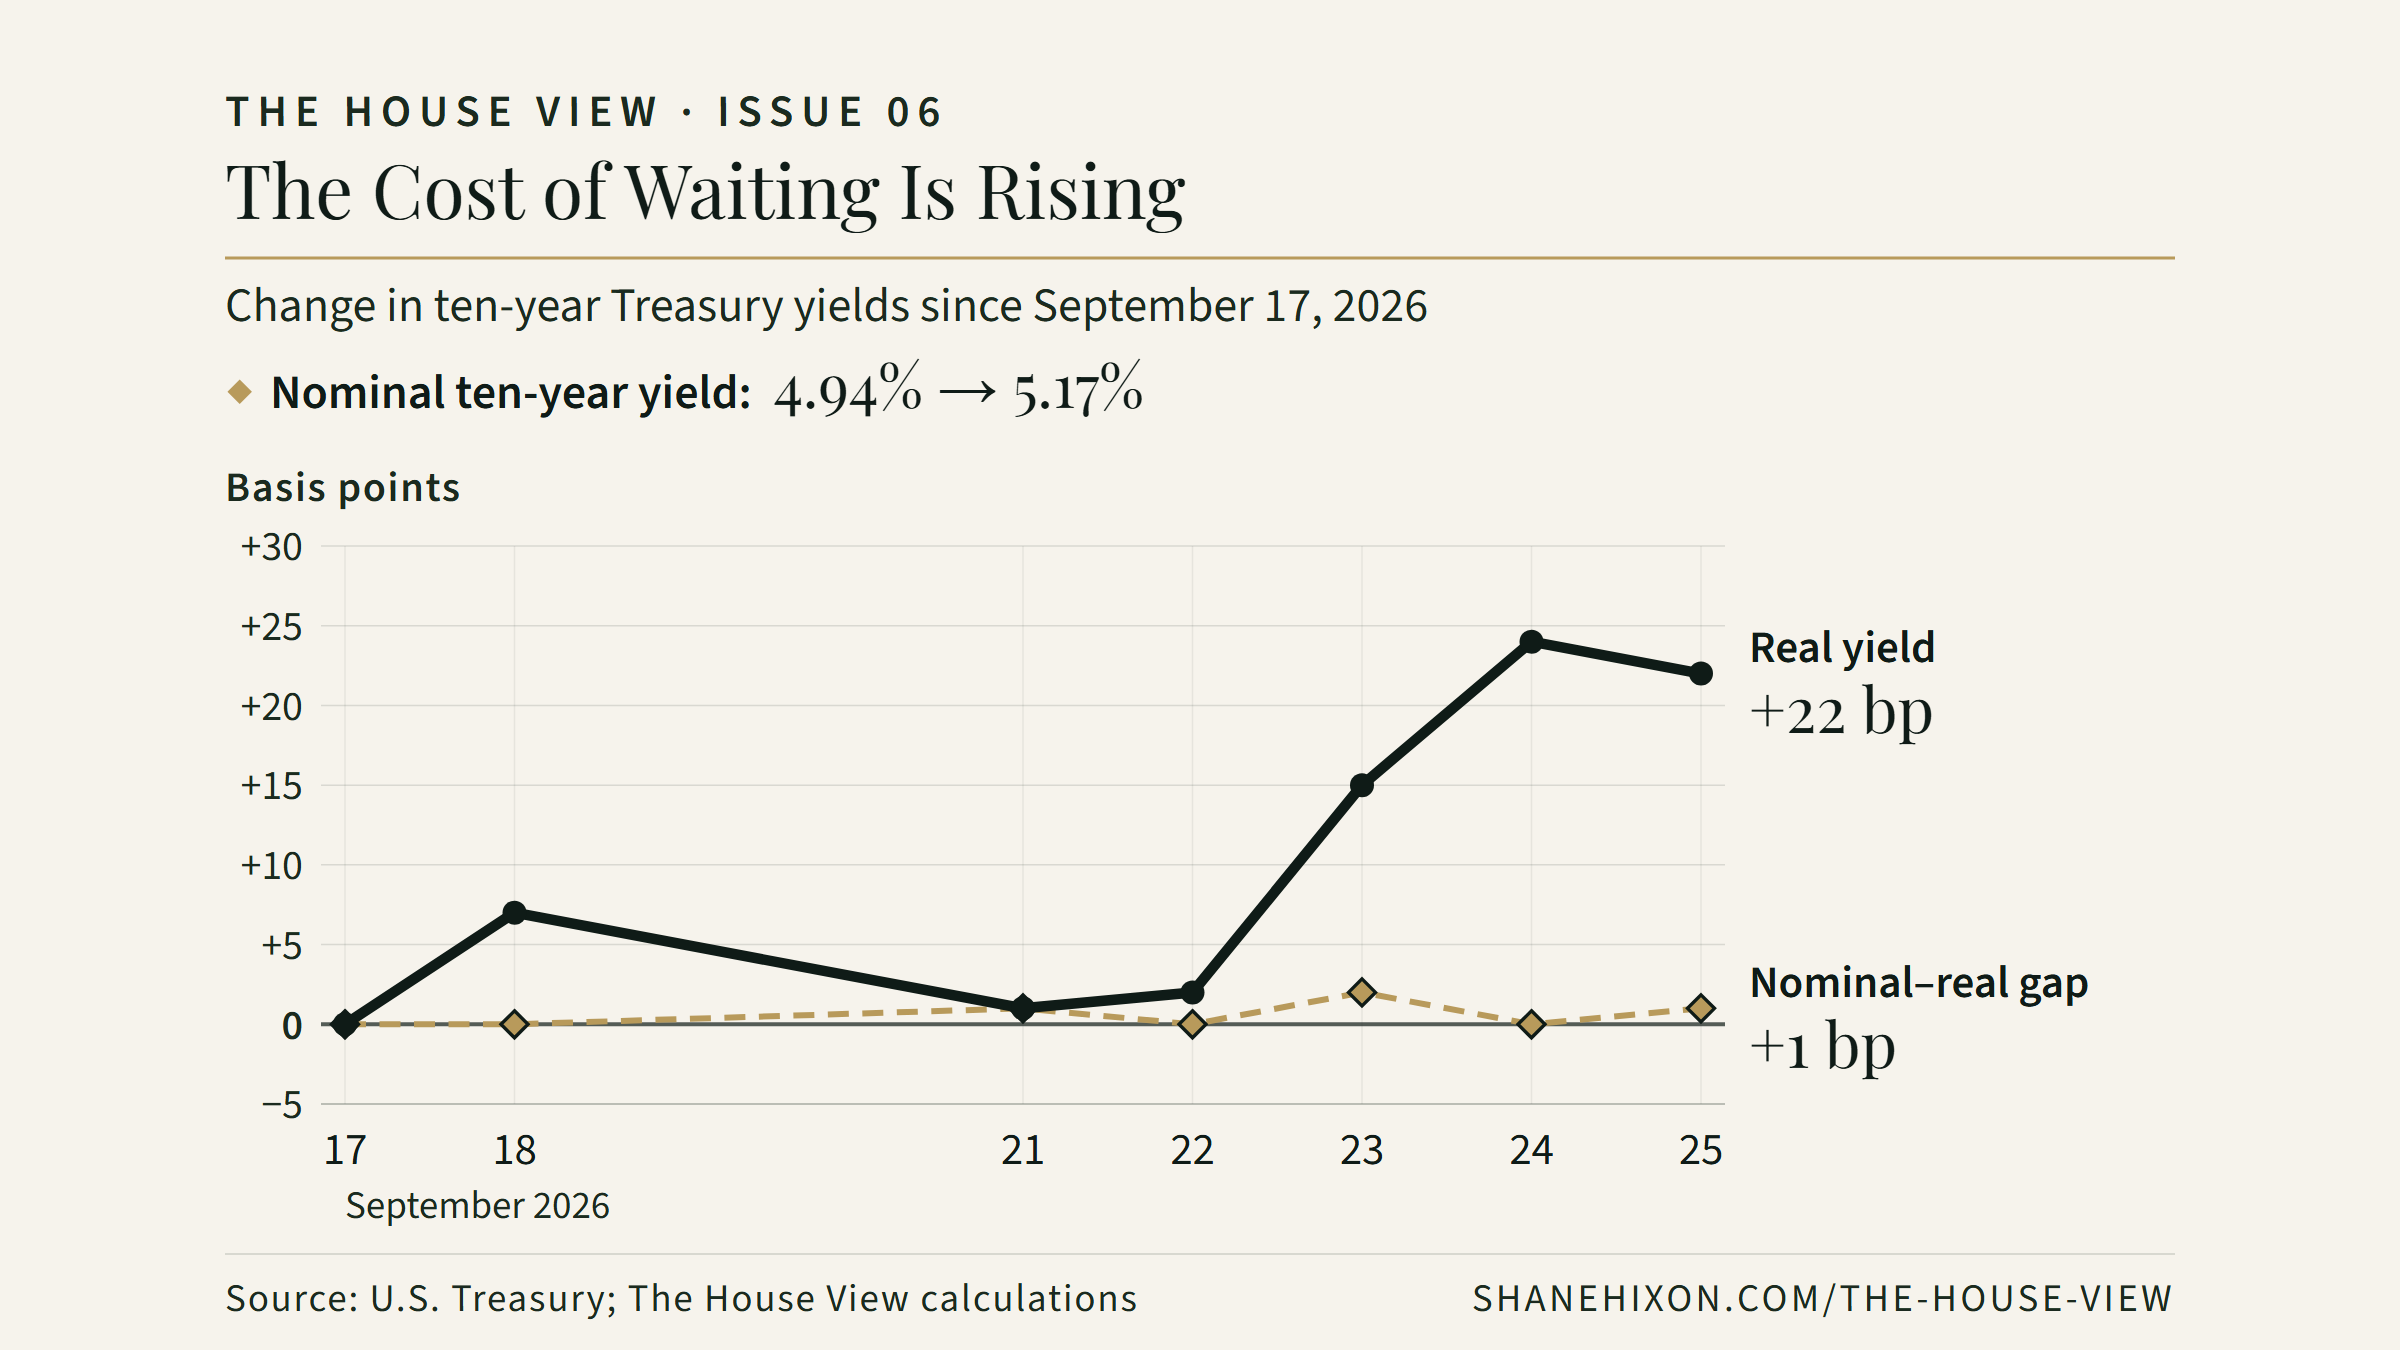
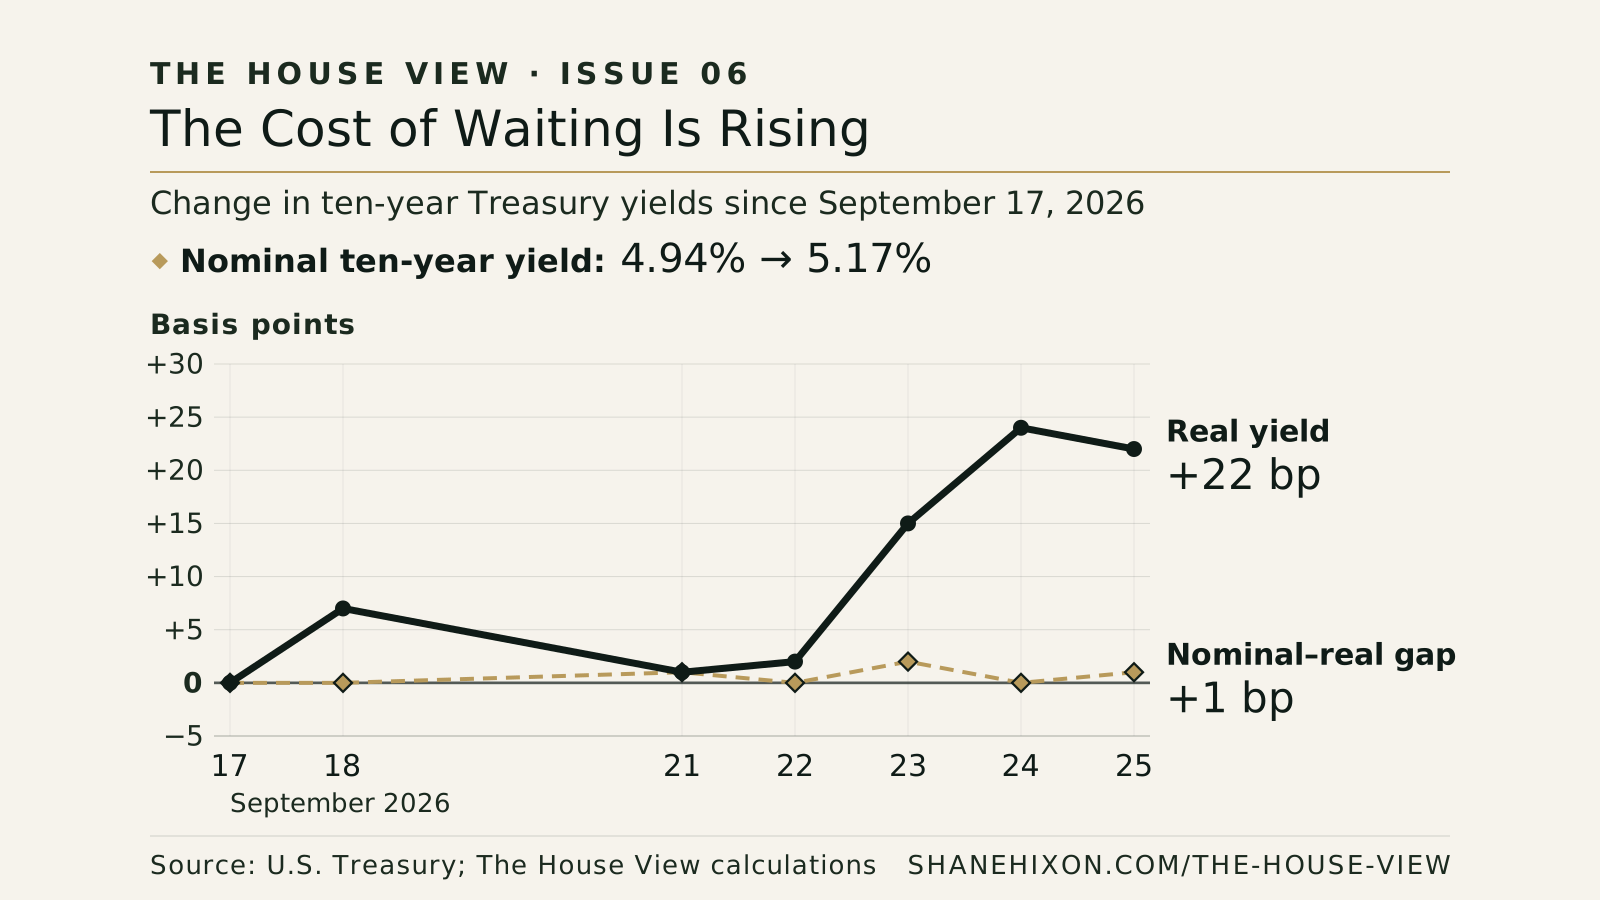
The ten-year Treasury yield reached 5.17% in the Treasury’s September 25 daily data, up from 4.94% on September 17, the relief-rally session covered in our last issue. The bond market has already taken back that reprieve. U.S. Treasury.
Equities have been more forgiving. Reuters reported Friday that enthusiasm for AI continued to support stocks even as Treasury yields climbed. Investors are still willing to finance the future. They are also demanding more compensation for waiting. Reuters.
Those positions can coexist. Stronger expected earnings can offset a higher discount rate. The question is how much improvement is required, and which businesses can deliver it before financing becomes a constraint.
The important move is underneath the headline
Over the same September 17–25 period, the ten-year inflation-protected Treasury yield rose from 2.61% to 2.83%. That is a 22-basis-point increase alongside the nominal yield’s 23-basis-point rise. The gap between them barely changed. U.S. Treasury, real yields.
This comparison is not a clean measurement of inflation expectations. The nominal–real yield gap also reflects risk and liquidity premiums. But it shows why describing the entire move as an inflation scare misses something important: the quoted return available on inflation-protected government debt has risen materially. Federal Reserve.

Show the data
| Date | Nominal 10-year | Real 10-year | Gap | Real change | Gap change |
|---|---|---|---|---|---|
| Sept. 17 | 4.94% | 2.61% | 2.33 | 0 bp | 0 bp |
| Sept. 18 | 5.01% | 2.68% | 2.33 | +7 bp | 0 bp |
| Sept. 21 | 4.96% | 2.62% | 2.34 | +1 bp | +1 bp |
| Sept. 22 | 4.96% | 2.63% | 2.33 | +2 bp | 0 bp |
| Sept. 23 | 5.11% | 2.76% | 2.35 | +15 bp | +2 bp |
| Sept. 24 | 5.18% | 2.85% | 2.33 | +24 bp | 0 bp |
| Sept. 25 | 5.17% | 2.83% | 2.34 | +22 bp | +1 bp |
Calculated from Treasury par yields, rounded to two decimal places. The nominal–real gap is an inflation-compensation proxy, not a pure measure of expected inflation; risk and liquidity premiums affect it. This is an arithmetic comparison, not a causal decomposition. Ten-year columns of Treasury’s daily par yield curve and par real yield curve. Real change is (real yield − 2.61) × 100; gap change is (nominal − real − 2.33) × 100. The window is fixed through September 25. Download the data as CSV or the chart as a scalable SVG.
For technology investors, that raises the bar. A dollar of profit expected ten years from now becomes less valuable today when the required return increases. Faster earnings growth can compensate. A compelling story alone cannot.
The ten-year yield is not a company’s borrowing rate or its cost of equity. It is a benchmark beneath a wider financing structure. Credit risk, maturity, leverage and investor appetite determine the additional return a business must offer.
AI has to pay for the physical world
The latest example comes from Australia.
Victoria has proposed requiring new data centers to secure renewable power and storage, bear grid-connection and upgrade costs, and use recycled or non-drinking water for cooling. These are proposed state requirements, not a nationwide rule already in force. Reuters.
The economic issue is who pays for the infrastructure around the servers. Requiring developers to fund those costs can protect existing utility customers. It also increases the capital a project must assemble before generating revenue.
That creates a difficult combination: more upfront spending, potentially longer development periods, and a higher financing hurdle. A well-funded operator may absorb it. A smaller developer may need additional equity, firmer customer commitments or a less ambitious project.
The U.S. power buildout presents the same investment tension. EIA reports that operators added 8.3 gigawatts of utility-scale battery storage during the first half of 2026. This is infrastructure already being installed, although those additions cannot all be attributed to AI demand. EIA.
More demand for generation, storage and transmission can create business opportunities while higher financing costs reduce project returns. Selling equipment and owning the asset being financed are different economic exposures.
The financing structure will separate the winners
“Technology” is too broad a category for this environment.
A business producing cash today has more flexibility than one repeatedly raising money to cover operating losses. An infrastructure project backed by a creditworthy customer differs from one built on hoped-for demand. A chip supplier can report strong sales while its customers are still working out whether their investment will earn an adequate return.
Higher yields sharpen those distinctions.
They also reach beyond technology. Mortgage borrowers face a higher financing hurdle; companies refinancing debt may face higher interest expense. Existing fixed-rate obligations delay some of the impact. The adjustment arrives as borrowing resets and new investments seek funding.
There is a constructive explanation for part of the pressure: a strong investment cycle can support growth and demand for capital. Successful AI adoption could eventually expand productive capacity.
The timing remains the problem. Construction and financing costs arrive before the productivity payoff.
Sources
- U.S. Department of the Treasury, Daily Treasury Par Yield Curve Rates, September 2026.
- U.S. Department of the Treasury, Daily Treasury Par Real Yield Curve Rates, 2026.
- Reuters, bond yields hit multi-decade highs despite oil pullback, September 25, 2026.
- Board of Governors of the Federal Reserve System, FEDS Notes, Tips from TIPS: Update and Discussions, May 21, 2019.
- Reuters, Australia’s Victoria proposes new data centres must secure their own renewable energy supply, September 22, 2026.
- U.S. Energy Information Administration, Today in Energy, battery storage capacity additions, August 7, 2026.